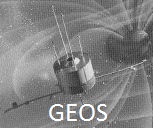
Plot data base GEOS
The GEOS mission consists of two GEOS-1 and GEOS-2 satellites, covering the periods from April 1977 to June 1978 for GEOS-1 and from July 1978 to January 1983 for GEOS-2.
Plots are available for search-coil spectrograms (3-hour period), fluxgate magnetometer plots (3 and 24-hour period), trajectories (24 hours), auxiliary data(24 hours), as well as maps showing the position of the footprint of the strengh lines on Earth (24 hours).
All of these plots are available on our GEOS-1 plot data base and GEOS-2 plot data base using an image browser designed for this data.
All plots in PNG format can also be accessed on our
GEOS-1 ftp server
or our
GEOS-2 ftp server
